3D Bar Charts
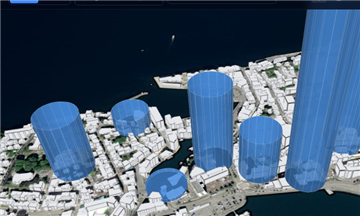
3D bar charts render extruded vertical bars anchored to geographic coordinates. Bar height is driven by a numeric attribute in your dataset, making it easy to compare values across locations at a glance.
Creating a 3D bar chart
- Import a GeoJSON or Shapefile layer containing point or polygon geometry with at least one numeric column.
- Open the layer in the Layers panel and expand its layer options.
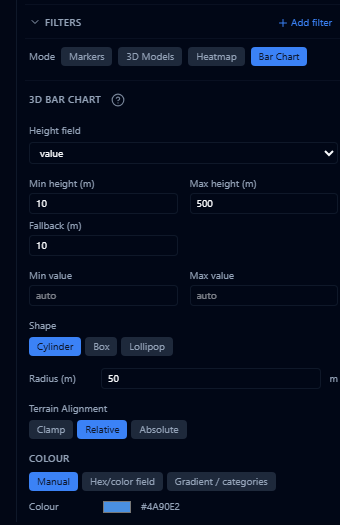
- Open the Filters section and set Mode to Bar Chart.
- Choose the height field from the dataset's numeric columns.
Style options
Height attribute
Height field is the dataset column whose values determine bar height. Only numeric columns are listed.
- Min height / Max height set the range (in meters) that the shortest and tallest bars are scaled to.
- Fallback height is used for features missing a value in the height field.
- Min value override / Max value override let you fix the data range used for scaling instead of relying on the dataset's actual min/max — useful when comparing layers or filtering outliers.
Shape and bar width
Choose a bar shape — Cylinder, Box, or Lollipop — and set the radius (in meters), which controls the horizontal footprint of each bar. Smaller radius values work better for dense datasets; larger values are easier to read at lower zoom levels.
Terrain alignment
Choose whether bars are clamped to ground, drawn relative to ground, or placed at an absolute height — matching the terrain alignment options available on other 3D layer types.
Bar color
Use the colour section to apply a fixed color to all bars, or color by attribute — mapping a categorical or numeric column to a color gradient. You can also adjust opacity and toggle bar outlines.
Labels
Enable Show label to display a text label above each bar, and choose which attribute the label shows.