Terrain & Environment Panel
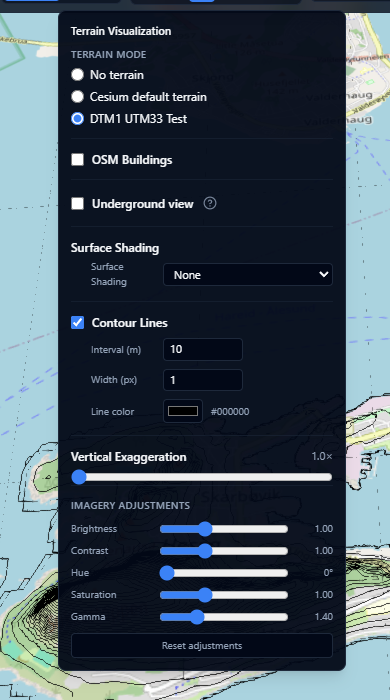
The Terrain panel controls how the ground surface looks — elevation shading, contour lines, vertical exaggeration, and basemap colour adjustments. It also controls which terrain dataset is used and whether OSM buildings are shown.
This page covers the global visual settings for the terrain surface. If you want to replace the terrain geometry itself with a custom elevation model, see Terrain Layers.
Open it by clicking the mountain icon in the centre toolbar. The button glows blue when any non-default setting is active.
Terrain mode
Choose which terrain dataset is used for the globe surface:
| Mode | Description |
|---|---|
| World | Cesium World Terrain — global coverage at up to 1-metre resolution |
| Bathymetry | Adds ocean floor depth data; the sea surface becomes transparent so you can see the sea bed |
Terrain shading
Apply a colour overlay to the terrain surface based on a computed property:
| Shading mode | What it shows |
|---|---|
| None | No shading — the basemap imagery is shown as-is |
| Elevation | Height above sea level, coloured using a ramp |
| Slope | Steepness of the terrain — flat areas are one colour, steep areas another |
| Aspect | Direction the slope faces (north, south, east, west) |
When a shading mode other than None is selected, choose a colour ramp:
| Ramp | Description |
|---|---|
| Bathymetry | Deep blue → green → yellow — suited to ocean depth |
| Terrain | Brown earth tones — suited to land elevation |
| Viridis | Purple → blue → green → yellow — perceptually uniform, colorblind-safe |
| Rainbow | Full spectrum — high contrast, not colorblind-safe |
Elevation range
When Elevation shading is selected, set the minimum and maximum values (in metres) to control which elevations are mapped to the ends of the colour ramp. Areas below the minimum are clamped to the start colour; areas above the maximum are clamped to the end colour.
The minimum value must be less than the maximum value. A validation error is shown if they are equal or reversed.
Contour lines
Enable Contour lines to draw elevation isolines on the terrain surface.
| Setting | Description |
|---|---|
| Interval | Vertical distance between contour lines, in metres (minimum 10 m) |
| Width | Line thickness in pixels (1–10) |
| Color | Line colour — click to open the colour picker |
Contour lines update in real time as you adjust the settings.
Vertical exaggeration
Stretch the terrain height to make subtle elevation differences more visible. The slider runs from 1× (no exaggeration) to 10×.
Click 1× to reset to no exaggeration.
Vertical exaggeration is useful for visualising relatively flat coastal or agricultural areas where real elevation differences are too small to see at a normal scale.
Imagery adjustments
Fine-tune the appearance of the basemap imagery without changing the actual data source.
| Setting | Default | Range | Effect |
|---|---|---|---|
| Brightness | 1.0 | 0–3 | Overall lightness of the imagery |
| Contrast | 1.0 | 0–3 | Difference between light and dark areas |
| Hue | 0° | 0–360° | Rotate the colour spectrum |
| Saturation | 1.0 | 0–3 | Colour intensity (0 = greyscale) |
| Gamma | 1.4 | 0.1–5 | Non-linear brightness correction |
Click Reset to restore all imagery adjustments to their default values.